Themes > Features
21.08.2001
Investment in the Time of Economic Liberalisation
There was a short but influential period in recent years when Indian
policy makers sought to persuade themselves and others that economic
liberalisation and greater reliance on market mechanisms would imply that
future economic growth would result from increased efficiency of
investment rather than rises in the investment to GDP ratio. This line of
reasoning used the argument that high ICORs (Incremental capital output
ratios) which were observed in India essentially reflected high costs and
inefficiency of resource use, which would be corrected by the liberalising
regime. This in turn, it was argued, would mean that higher growth would
result even from the same rate of investment, as ICORs would fall across
sectors.
The actual pattern of growth over the 1990s has belied that assumption, especially as growth rates have spluttered and decelerated in the past few years. There is now less talk in official policy circles about improved ICORs (especially since the data indicate anything but such improvement) and more declaration that the reforms have succeeded in bringing about an increase in the aggregate rate of investment in the economy.
But is such an assertion justified ? In what follows, we examine the aggregate trends in investment over the past two decades, followed by a more disaggregated look at particular sectoral investment patterns since 1993-94. Such an exercise reveals that the ten years of liberalising reform thus far have not marked any break from previous trends in terms of increasing investment rates : rather, if anything, the longer run tendency of savings and investment rates appears to have slowed down over this period. Further, in the 1990s certain sectors and forms of capital formation have actually experienced declines.
Consider first the patterns in investment, savings and GDP growth over the past two decades. Chart 1 provides estimates of gross domestic capital formation and gross domestic savings as percentages of GDP, along with the rate of growth of GDP at 1993-94 prices from 1980-81 onwards. The first point to note is that GDP growth itself does not show any marked increase in the decade of the 1990s compared to the 1980s, and in fact after the peak rates of more than 7 per cent achieved during the middle of the decade have subsequently been lower.

As Chart 1 shows, both savings and investment rates have increased over time. This increase in both is part of a trend of much longer duration, whereby savings and investment rates have tended to increase with economic development and as the economy expands, in an Engels curve type pattern whereby increased aggregate incomes also allow for a larger share for savings. Thus we find that savings rates have increased from an average of 9 per cent in the early 1950s, to 12 per cent in the early 1960s, to 15 per cent in the early 1970s, to 18 per cent in the early 1980s.
The increase in the subsequent period can be seen as part of this broad tendency. However, here it is interesting to note that while the year-on-year rate of increase of the investment rate between 1981-82 and 1990-91 was 20.5 per cent, between 1991-92 and 1999-2000 it was lower at 18.7 per cent. The rate of Gross Domestic Capital Formation increased from 20.3 per cent to touch a peak of 26.8 per cent in 1995-96, and has since declined and stagnated at around 23 per cent. Similarly, while the rate of savings increased by 16.4 per cent between 1981-82 and 1990-91 and reached a peak level of 25.1 per cent in 1995-96, over the period 1991-92 to 1999-2000 it actually fell marginally.
This is significant because the acceleration in rate of growth during the latter half of the 1980s occurred essentially because the investment rate which stood at around 20 per cent at the beginning of the 1980s rose to around 25 per cent by the end of that decade. As compared to this we find that during the 1990s, barring three years around the middle of the decade of the 1990s, the investment rate ruled at or well below its end-1980s level. Clearly, there is a link between the investment rate and growth, as is to be expected, and the current slowdown is the result of slack investment demand in the economy. Not surprisingly, the capital goods sector is the worst affected in the current recession.
Chart 2 allows a more disaggregated look at the behaviour of the savings rate. The important compositional change that is evident here is the gradual decline in public sector savings as a share of GDP. In fact the public sector over the 1990s moved from being a contributor to savings to being a net dissaver. This decline was not counterbalanced by increased private corporate savings; rather, it is the increased share of household savings which has prevented the savings rate from declining even further. The share of household savings in Gross Domestic Savings increased from 73 per cent in 1980-81, to 83 per cent in 1990-91, to as much as 89 per cent in 1999-2000. Private corporate savings reached a peak of 4.9 per cent of GDO in 1996-96 and subsequently declined to 3.7 per cent by the end of the decade.

Many neo-liberal reformers have argued that in a world of substantially more mobile capital, domestic savings is no longer the potential constraint on investment and growth that it could be when demand is not the binding constraint. Rather, it is typically suggested that what really matters is a deregulated environment designed to be attractive to external investors, which would attract foreign savings and allow domestic investment to increase accordingly. In accordance with this view, government policy over the 1990s sought to be increasingly attractive to foreign investment of all varieties, not only by removing a range of restrictions on inward capital flows of both long term and short term nature, but also through a number of fiscal and interest rate concessions. Success on this front – in terms of thereby attracting more foreign savings – would have to be measured in terms of the investment-savings gap (which in turn reflects the current account deficit and changes in foreign exchange reserves).
By this measure, the policy efforts of the 1990s appear to have been remarkably unsuccessful. The investment-savings gap as a share of GDP in the 1990s has remained at a level much lower than the average of the 1980s. As Chart 3 shows, the gap was largest in the latter part of the 1980s, when it amounted to 2.5 per cent of GDP, and has been at only 1.3 per cent of GDP subsequently. Thus, even in its own terms, the strategy of designing domestic economic policies to please foreign investors in order to add to domestic savings has failed to attract more foreign investment.

At the peak of state involvement in the industrialisation process, in the period from the mid-1950s to the mid-1960s, the public sector accounted for well over half of gross domestic capital formation. In fact, this proportion continued even into the 1970s, and at is height in 1974-75 the public sector share of total domestic investment was as high as 65 per cent. Over the first half of the 1980s, as can be seen from Chart 4, the share of the public sector in gross domestic capital formation was roughly stable at around half, but towards the latter part of the decade, and especially after 1986-87, it began to decline both as a share of total investment and as a share of GDP.

Over the 1990s, the share of the public sector in investment has slipped quite substantially. In terms of proportion of GDP, the year-on-year decline in public sector capital formation from the beginning to the end of the decade has been as high as 2 percentage points. This reflects the general perception of declining state involvement in productive investment activity, which is mirrored in the budgetary variable of declining capital expenditure of the Central Government as a share of GDP, but extends the decline to all public sector entities taken together.
Instead, over the 1990s, private sector investment appears to have risen until 1995-96, and thereafter declined to settle at the rates observed for the late 1980s. This increase was not sufficient to offset the decline in public investment over the 1990s in terms of the unadjusted total. Instead, a substantial factor in determining the final gross capital formation figure over these two decades appears to have been in terms of errors and omissions.
These errors and omissions reflect the differences that emerge when reconciling the commodity flow estimates of investment with the financial flows that emerge also from the balance of payments figures. Thus they amount to domestic saving plus net capital flow from abroad minus unadjusted gross domestic capital formation. It is interesting to note that, while the errors and omissions do fluctuate to some extent as expected, there is a definite tendency to move from negative levels in the 1980s to positive levels in the 1990s. It is not clear whether this also reflects some broader tendency which is not being adequately captured in the data.
Chart 5 and the subsequent charts focus on the period after 1993, since the new series of National Accounts begins with base year 1993-94. Chart 5 is extremely interesting because it reveals some relatively less known aspects of the composition of capital formation. It turns out that, insofar as investment has increased over the 1990s, it has dominantly been due to the increase in household investment (which is the counterpart of household physical savings as described earlier). Private corporate investment increased only slightly and then tapered off from 1996-97, while public investment, as mentioned earlier, declined over most of the decade and only increased slightly in the last two years.

This has meant that, while the public sector’s share of investment fell from 1993-94 to reach only 28 per cent by 1999-2000, the share of private corporate investment increased only marginally was at only 31 per cent at the end of the decade. By contrast, the share of investment by private households increased from 35 per cent in 1993-94 to as much as 41 per cent by 1999-2000. It is a moot point how much of this reflects increases in what could otherwise be called luxury consumption, whether in the form of luxury housing which is classified as physical asset creation, or in the purchase of luxury vehicles which are classified as transport equipment.
The substantial slowdown in private corporate investment obviously reflects relatively depressed expectation regarding the of the market in the current recessionary conditions. But it also is bad news for the future, since it means that future activity and output will also be affected. The best means to reverse this would be to reverse the downward tendency of public productive investment, but that would in turn imply a substantial revision and transformation of the entire economic reform strategy of the past decade.
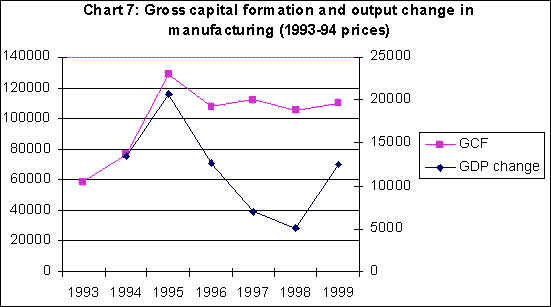
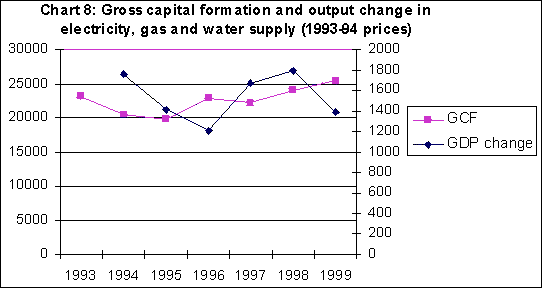
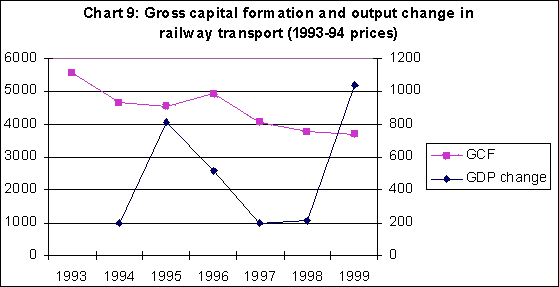
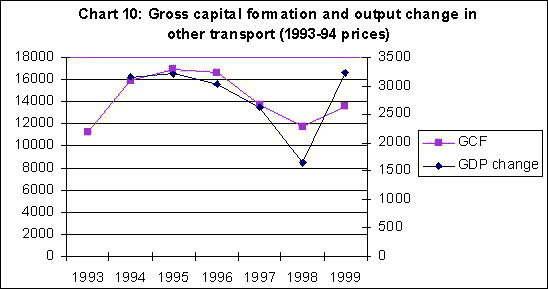
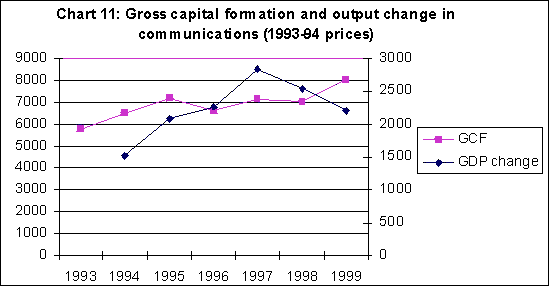
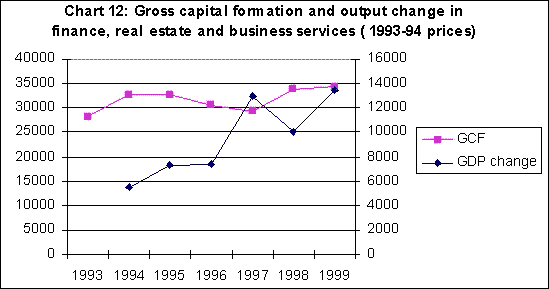
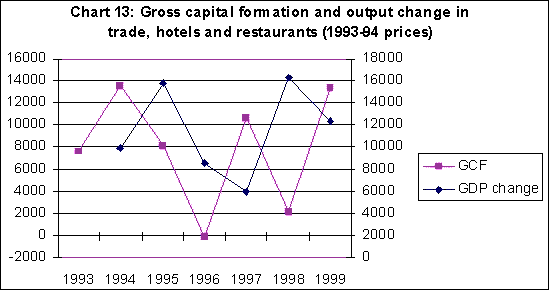
Charts 6 to 13 examine the patterns of gross capital formation and change in output by specific sectors in the period 1993-94 to 1999-2000. This obviously provides a sectorally disaggregated sense of investment behaviour. But it also gives a broad indication of how output has moved relative to investment, in other words whether ICORs (which measure the incremental output consequent upon new investment) would have a useful applicability in this context.

The charts immediately suggest that any ICOR calculations would produce highly volatile and questionable results for the different sectors over the period in question. In all of the sectors, output (that is GDP by sector) has been quite volatile and estimates of ICOR would be quite problematic.
Consider the case of agriculture, described in Chart 6. This is one of the few sectors to show a definite increase in investment over this period. Despite this, however, GDP in this sector has fluctuated very significantly, and certainly show no positive time trend.
In manufacturing, described in Chart 7, there has been a definite stagnation and even decline in investment after 1994-95. This is noteworthy because it suggests that the deceleration investment in this sector began before the industrial recession which is typically dated from around the middle of 1996. The changes in GDP in manufacturing appear to be even sharper than those in investment in this sector.
Investment in the infrastructure sectors of electricity, gas and water, shown in Chart 8, appear to have increase since 193-94 in real terms. However, railway investment has slumped dramatically, as indicated in Chart 9. Since railways remains among the most significant means of goods traffic in the country, besides serving the transport needs of the bulk of the population, this collapse in railway investment is a real source of concern. By contrast, the railways does not appear to have performed quite so poorly in terms of GDP growth. However, not just the railways but even other transport sectors appear to have been hit by falling real investment since 1993-94. They show a declining trend in investment (Chart 10) except for the last year, and it must be borne in mind that the data for the last year are still provisional and subject to substantial change going by past experience.
The opposite tendency from railways seems to at work in the communications sector, for which the data are displayed in Chart 11. Here, as expected, capital formation has been quite strong and growing in real terms, but output expansion seems to be less dynamic than would be indicated by the dynamism of investment.
Finance was for a time a booming sector, and in any case in economies where there is an initial phase of financial liberalisation there tends to be a temporary boom in financial and business services as well as in real estate. Therefore it is not surprising that investment in these sectors increased in real terms as shown in Chart 12, despite a slump over 1996-97. However, there appear to be no significant time trend for investment in trade, hotels and restaurants (Chart 13), which show extreme volatility both in investment and in changes in output over this period.
The overall picture, then, is one of relatively sluggish investment despite the slight increase in investment rates which is part of a longer time trend. It is of even greater concern that most of the new investment appears to have come in recent years from private household investment, as corporate investment has stagnated and public investment has actually fallen. These tendencies bode ill for future growth prospects unless the overall macroeconomic strategy of the government is completely reversed from that which has dominated over the past decade.
© MACROSCAN 2001